科学の箱

科学・IT・登山の話題

R 機械学習

ジニ係数(再掲)

投稿日:2014年5月15日 更新日:

ジニ係数について修正した。とりあえずコード。

revenue<-read.csv(file="data.csv", head=TRUE)
revenue$TotalRevenues_n <- as.numeric(gsub(pattern = ",", replacement = "", x = revenue$TotalRevenues, fixed = TRUE))
head(revenue)
class(revenue$TotalRevenues_n)
ineq(revenue$TotalRevenues_n, type="Gini")
plot(Lc(revenue$TotalRevenues_n), col="red", lwd=2)
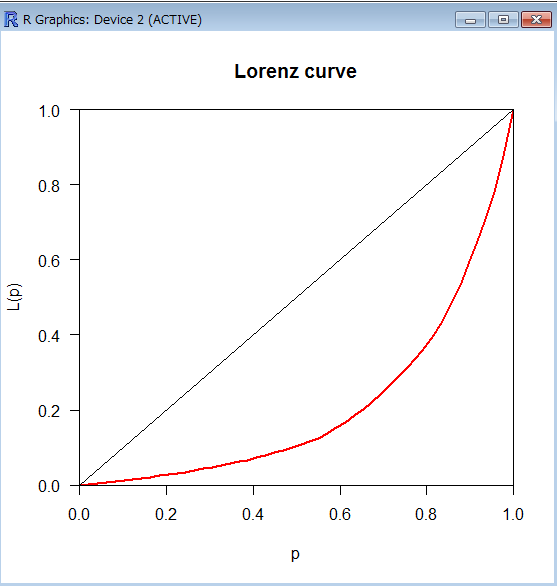
ロレンツカーブ

lc


メタ情報

inarticle


メタ情報

inarticle


-R, 機械学習
-

執筆者:


  1. foo-bar-baz より:

    詰めが甘いですね。
    plot(Lc(revenue$TotalRevenues), col=”red”, lwd=2)
    ではなく,
    plot(Lc(revenue$TotalRevenues_n), col=”red”, lwd=2)
    ですね。

  2. admin より:

    ありがとうございます。確かに0.3と0.5だと形が明らかに違いました。

comment

メールアドレスが公開されることはありません。 * が付いている欄は必須項目です

関連記事

no image

Core Concept in Data Analysis – Week 3

2d Analsysis 分布図 相関 回帰分析 因果関係 ガルトンはダーウィンのいとこ Related posts:DictVectorizerを使ってカテゴリデータについて特徴抽出をするPytho …

no image

Statistical Reasoning for Public Health

Module up to 3 SES – 社会経済的地位 Cognitive function – 認知機能 The authors used the graphic alon …

no image

UCI datasets

データ分析の勉強をするときに便利なUCI datasets https://archive.ics.uci.edu/ml/datasets.html Related posts:R Dataset – …

no image

Rによるやさしい統計学/7-分散分析

(1)学部によりテストの結果に有意な差があるかを調べる。 データはcsv形式で作成し、7_1_test_score.csvとする。以下はデータの内容。 法学部,文学部,理学部,工学部 75,62,65 …

no image

K近傍法と決定木の比較

One of the most comprehensible non-parametric methods is k-nearest-neighbors: find the points which …

2014年5月
« 4月   6月 »
 1234
567891011
12131415161718
19202122232425
262728293031  

side bar top


アーカイブ

カテゴリー