科学の箱

科学・IT・登山の話題

Python

matplotlibでfigureを利用する

投稿日:2018年3月23日 更新日:

matplotlibでfigureオブジェクトを利用するとグラフを表示する位置を細かく指定できる。

まずはfigureを使ってグラフを一つ表示してみる。


>>> import matplotlib.pyplot as plt
>>> import numpy as np
>>> x = np.arange(0,20,2)
>>> y = x ** 2
>>> fig = plt.figure()
>>> axes = fig.add_axes([0.1, 0.1, 0.8, 0.8])
>>> axes.plot(x,y)
>>> axes.set_xlabel('X label')
>>> axes.set_ylabel('Y label')
>>> axes.set_title('Title')
>>> plt.show()
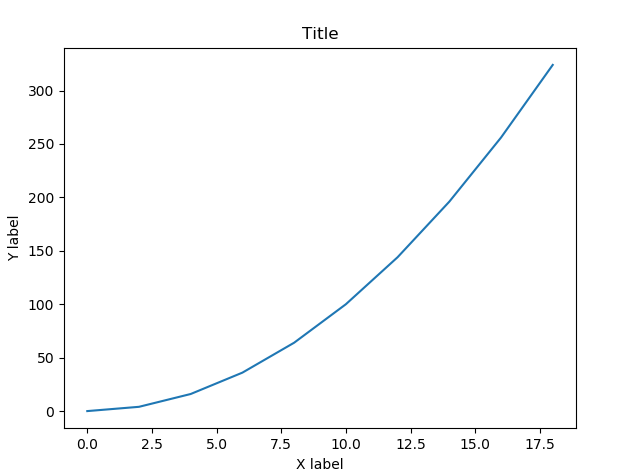


次にaxesを複数追加してサブプロットを表示する。


>>> fig = plt.figure()
>>> axes = fig.add_axes([0.1, 0.1, 0.8, 0.8])
>>> axes_1 = fig.add_axes([0.2, 0.2, 0.4, 0.3])
>>> axes.plot(x,y)
>>> plt.show()




メタ情報

inarticle


メタ情報

inarticle


-Python

執筆者:


comment

メールアドレスが公開されることはありません。 * が付いている欄は必須項目です

関連記事

no image

特定のパッケージのためのgitignoreを作成したい

https://gitignore.ioを開く パッケージ名を入力 Createをクリック Related posts:python data scientist bootcamppython cod …

no image

automated the boring

まずは肩慣らし print(‘Hello world!’) print(‘What is your name?’) # ask for their na …

no image

Pythonで文字列を生成するときの方法についてまとめる

Pythonで文字列を生成するときには様々な方法があるのでまとめる。 まず最も基本となるのは生成したい文字をシングルクォーテーションもしくはダブルクォーテーションで囲む方法である。どちらの方法を使って …

no image

pythonからoffice365 smtpを利用してメールを送信

Office365の設定はこちらにある。 PythonにおけるSMTPの利用はこちらにある。 下記はサンプルコード import smtplib from email.mime.text import …

no image

Python + Slack Bot – 3

さてリアルタイムでとりあえずうまくいったので、もう少し違うサンプルコードを試してみる。 参考にしたのはこちら。 https://www.fullstackpython.com/blog/build-f …

2018年3月
« 2月   4月 »
 1234
567891011
12131415161718
19202122232425
262728293031  

side bar top


アーカイブ

カテゴリー