科学の箱

科学・IT・登山の話題

Python

連続データのビジュアル

投稿日:2018年6月5日 更新日:

Kaggle TitanicのFareを使っていくつかビジュアル

金額別ヒストグラム-1
  • titanic_df['Fare'].plot(kind='hist', figsize=(15,3),bins=100, xlim=(0,50))
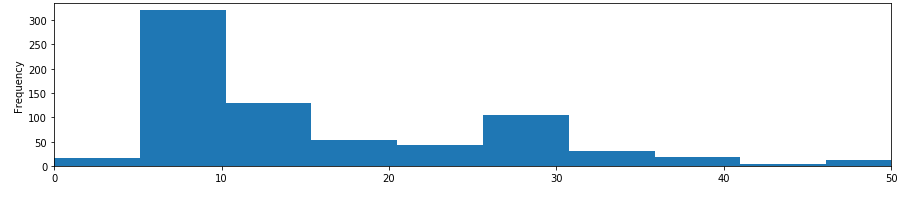
xlimが簡単に設定できる


金額別ヒストグラム-2
  • sns.distplot(d_train[“Fare”], kde=False, rug=False, bins=100)
 
xlimは軸で設定するのでひと手間かかる
生存別金額-1
  • avgerage_fare = pd.DataFrame([fare_not_survived.mean(), fare_survived.mean()])
  • std_fare = pd.DataFrame([fare_not_survived.std(), fare_survived.std()])
  • avgerage_fare.plot(yerr=std_fare,kind=’bar’,legend=False)
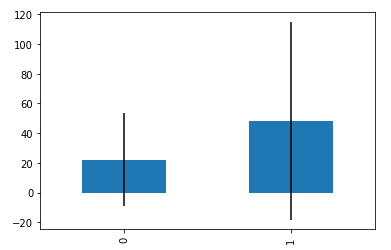
みやすい。


生存別金額-2
  • sns.boxplot(x=’Survived’, y=”Fare”, data=d_train, palette=”PRGn”)
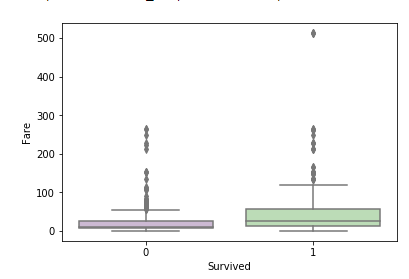
外れ値に左右される→外れ値を削除する。


生存別金額-3

  • sns.violinplot(x=’Survived’, y=”Fare”, data=d_train)

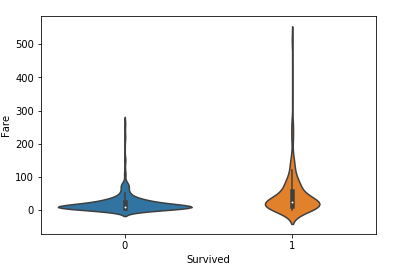
概要をつかむにはboxplotよりよい。

メタ情報

inarticle


メタ情報

inarticle


-Python
-

執筆者:


comment

メールアドレスが公開されることはありません。 * が付いている欄は必須項目です

関連記事

no image

GCP google translatorの利用

こちらが詳しい https://cloud.google.com/translate/docs/reference/libraries#client-libraries-usage-python &n …

no image

pythonからgoogle translateを使う

まずはパッケージをpip経由でインストール pip install googletrans これで完了。あとは利用するだけです。 日本語を英語に翻訳するとき。 translator = Transla …

no image

automated the boring – day 3

https://automatetheboringstuff.com/ 今回はまずは文字列操作から。とりあえず基本のところを押さえておく。 print("Hello there!\nHow …

no image

kaggle Titanic Tutorial – 11

kaggleで人気があるlightGBMをつかってみる。   インストール pip install lightgbm 特に問題がなく終了。 コード、関係するところだけ記載。 split_be …

no image

RoboBrowserでUser Agentが原因ではねられているとき

RoboBrowserを利用していると通常のブラウザでリクエストした時とは異なりエラーがページが返ってくることが多い。 原因はいくつかあるがまず試したいのはUser-Agentの設定。 RoboBro …

2018年6月
« 5月   9月 »
 123
45678910
11121314151617
18192021222324
252627282930  

side bar top


アーカイブ

カテゴリー