科学の箱

科学・IT・登山の話題

Python

matplotlibでfigureを利用する

投稿日:2018年3月23日 更新日:

matplotlibでfigureオブジェクトを利用するとグラフを表示する位置を細かく指定できる。

まずはfigureを使ってグラフを一つ表示してみる。


>>> import matplotlib.pyplot as plt
>>> import numpy as np
>>> x = np.arange(0,20,2)
>>> y = x ** 2
>>> fig = plt.figure()
>>> axes = fig.add_axes([0.1, 0.1, 0.8, 0.8])
>>> axes.plot(x,y)
>>> axes.set_xlabel('X label')
>>> axes.set_ylabel('Y label')
>>> axes.set_title('Title')
>>> plt.show()
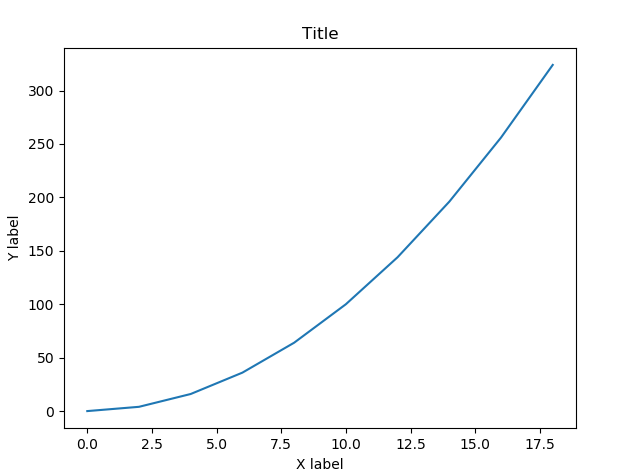


次にaxesを複数追加してサブプロットを表示する。


>>> fig = plt.figure()
>>> axes = fig.add_axes([0.1, 0.1, 0.8, 0.8])
>>> axes_1 = fig.add_axes([0.2, 0.2, 0.4, 0.3])
>>> axes.plot(x,y)
>>> plt.show()




メタ情報

inarticle


メタ情報

inarticle


-Python

執筆者:


comment

メールアドレスが公開されることはありません。 * が付いている欄は必須項目です

関連記事

no image

pythonでpostgresqlを使うときに必要なモジュール

pip install psycopg2-binary Related posts:bing image searchをpythonで利用graphvizのコマンドラインから実行numpyで三角関数の …

no image

SIGNATE お弁当の需要予測-5

相関の概要を見てみる。これによりどの変数を利用して回帰するかを考える。 sns.heatmap(d_train_w.corr(),cmap=’coolwarm’) Related posts:data …

no image

wordpress-xmlrpc

WordPressへPythonから投稿してみる。 まずは設定から。説明はこちらにある。 https://python-wordpress-xmlrpc.readthedocs.io/en/lates …

no image

django install

まずはdjangoをインストールする pip install django   Versionを確認する python -m django –version はじめてのプロジェク …

no image

pycharmでターミナルからconda環境を利用する

pycharmでTerminalを開く conda環境を開く %windir%\System32\cmd.exe “/K” C:\ProgramData\Anaconda3\S …

2018年3月
« 2月   4月 »
 1234
567891011
12131415161718
19202122232425
262728293031  

side bar top


アーカイブ

カテゴリー