matplotlibでfigureオブジェクトを利用するとグラフを表示する位置を細かく指定できる。
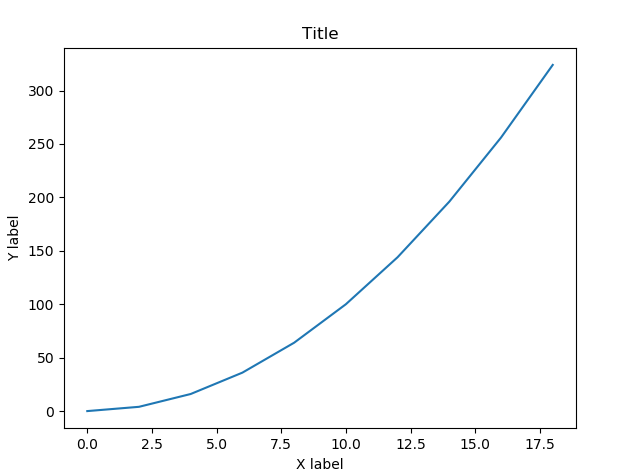
まずはfigureを使ってグラフを一つ表示してみる。
>>> import matplotlib.pyplot as plt
>>> import numpy as np
>>> x = np.arange(0,20,2)
>>> y = x ** 2
>>> fig = plt.figure()
>>> axes = fig.add_axes([0.1, 0.1, 0.8, 0.8])
>>> axes.plot(x,y)
>>> axes.set_xlabel('X label')
>>> axes.set_ylabel('Y label')
>>> axes.set_title('Title')
>>> plt.show()
次にaxesを複数追加してサブプロットを表示する。
>>> fig = plt.figure()
>>> axes = fig.add_axes([0.1, 0.1, 0.8, 0.8])
>>> axes_1 = fig.add_axes([0.2, 0.2, 0.4, 0.3])
>>> axes.plot(x,y)
>>> plt.show()

